
Lottery last-digit charts: count the numbers in each group first
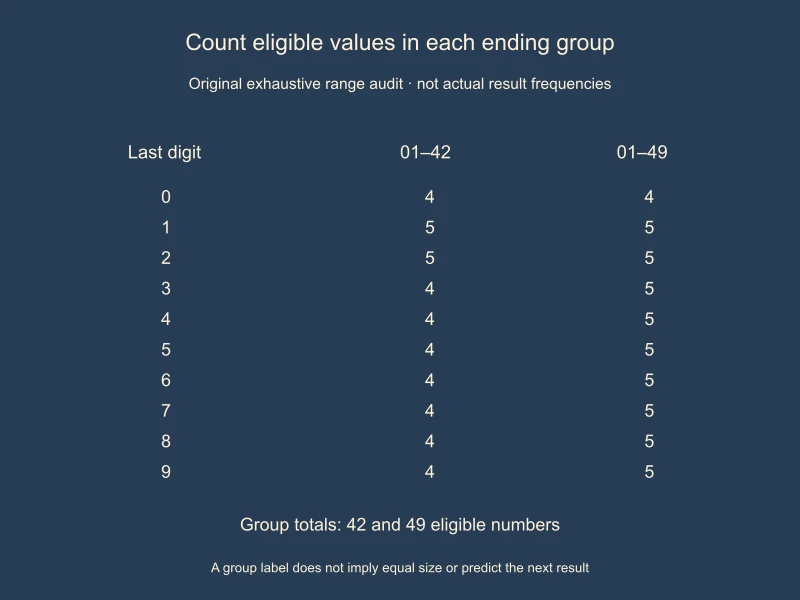
The ten last-digit groups need not contain the same number of eligible values. In the range 01–49, only four numbers end in 0, while five end in each digit from 1 through 9. Treating every group as one tenth of the pool creates the wrong baseline.
This exercise in the jilino1 lottery section uses fictional uniform six-number models. It explains how to read a grouped chart; it does not audit a real draw or predict a result.
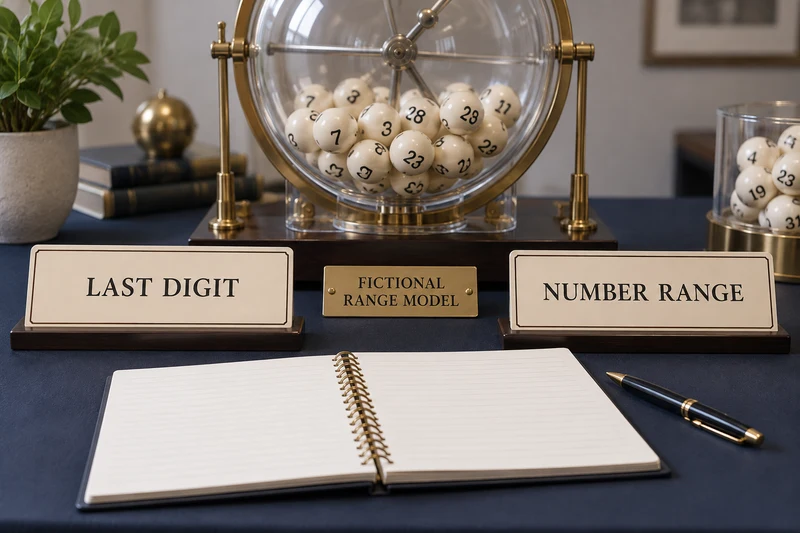
Build the groups from the stated range
For values 01 through 49, the ending-0 group is {10,20,30,40}. The ending-1 group is {01,11,21,31,41}. There are four values in the first group and five in the second.
The same last-digit labels behave differently in the range 01–42. Digits 1 and 2 still have five eligible values each, but digits 0 and 3 through 9 have four each. A chart cannot borrow its baseline from another game’s range.
| Last digit | Values in 01–42 | Values in 01–49 |
|---|---|---|
| 0 | 4 | 4 |
| 1 or 2, each | 5 | 5 |
| 3 through 9, each | 4 | 5 |
The counts sum to 42 and 49 respectively. We generated every eligible value, grouped it by its final decimal digit and checked both totals. A missing endpoint or an accidental inclusion of 00 would change the groups.
Compare expected appearances under a stated model
Suppose six distinct numbers are sampled uniformly without replacement from 01–49. Each particular number has an inclusion probability of 6/49. The group of four ending-0 values therefore has an expected 4 × 6/49 = 24/49 appearances per draw, approximately 0.490.
A group containing five values has expected 5 × 6/49 = 30/49 appearances, approximately 0.612. These are average appearance counts under the model, not probabilities that the group appears at least once. They need not be whole numbers.
OpenStax’s hypergeometric chapter describes sampling without replacement from two groups and the mean group count. Here the two groups are values with the chosen last digit and all other eligible values. The range groups and lottery illustration are our own calculation.
Across all ten ending groups, the expected counts add to six: 24/49 + 9 × 30/49 = 6. Assigning an expected 0.6 to every group would produce the right grand total but the wrong individual group baselines.
Two appearances can belong to one draw
Use the fictional result {10,20,21,32,43,49}. The ending-0 group has two appearances, from 10 and 20. But only one draw has been observed, so the count of draws containing that group is one.
A chart of ball appearances and a chart of draws with at least one such value answer different questions. Keep their denominators and labels separate. A percentage formed from six ball appearances cannot be silently relabelled as a percentage of draws.
Group size does not favour a particular full selection
A category containing more eligible values can have a larger model-average count. That does not make a particular number in that category more likely than a number in another category: each individual value still has inclusion probability 6/49 in this model.
Likewise, any fixed six-number set represents one exact outcome among all equally likely six-number sets. A grouped pattern is a collection of outcomes, rather than a forecast for one complete selection. The calculations provide no method for identifying the next drawn numbers.
Identify the source before analysing an archive
The national-versus-local source guide explains why game and event identity must be established first. Add the eligible range, replacement rule and exact chart measure before building last-digit groups.
Then report the actual archive period, missing or unresolved records, and whether the chart counts appearances or events. A short observed sample can differ from its model expectation. Group totals alone do not establish bias, fairness, independence or an advantage in choosing numbers.
Range audits and arithmetic checked on 10 October 2026. No real historical draw dataset, operator availability, ticket or payment was investigated for this example.